
CELESTIAL STUDIES
Unit IV · Lesson 19What Stars Are & How Far They Are
Professor Vesper Glimmerwick
Astronomer & Celestial Historian
The Celestial Tower • School of Evershade
Professor's Introduction

The telescope is awake, scholars,
Every evening I leave the Celestial Tower the way you might leave your front door: wings open, night air under them, and the whole sky waiting. I have done this thousands of times. And every single time, the stars do something to me that no amount of study has worn away. They look flat. They look like a dark ceiling pricked with tiny holes of light, all at exactly the same distance, all the same kind of thing.
They are not flat. They are not at the same distance. They are not even the same kind of thing. Some are small red embers barely massive enough to burn at all. Some are blue-white furnaces so hot they would vaporize our entire planet from a hundred times farther away than the sun. And every point of light you see is a message that traveled for years, centuries, or millennia to reach your eyes tonight. The flatness is an illusion. The depth is the truth, and the truth is so much better.
This lesson does two things, and they are the two most important things this course will ever teach you. First, it tells you what stars actually are: how they burn, why they are different colors, and how they live and die. Second, it tells you how we learned to measure the distance to them, which is one of the greatest detective stories in all of science. It ends with a woman who was not allowed to look through a telescope, who measured the universe anyway, from a desk, with glass photographs and patience.
Bring a pencil tonight. We are doing arithmetic, but I promise it is the gentlest arithmetic you have ever met.
PROFESSOR VESPER GLIMMERWICK
Celestial Studies
Astronomer & Celestial Historian
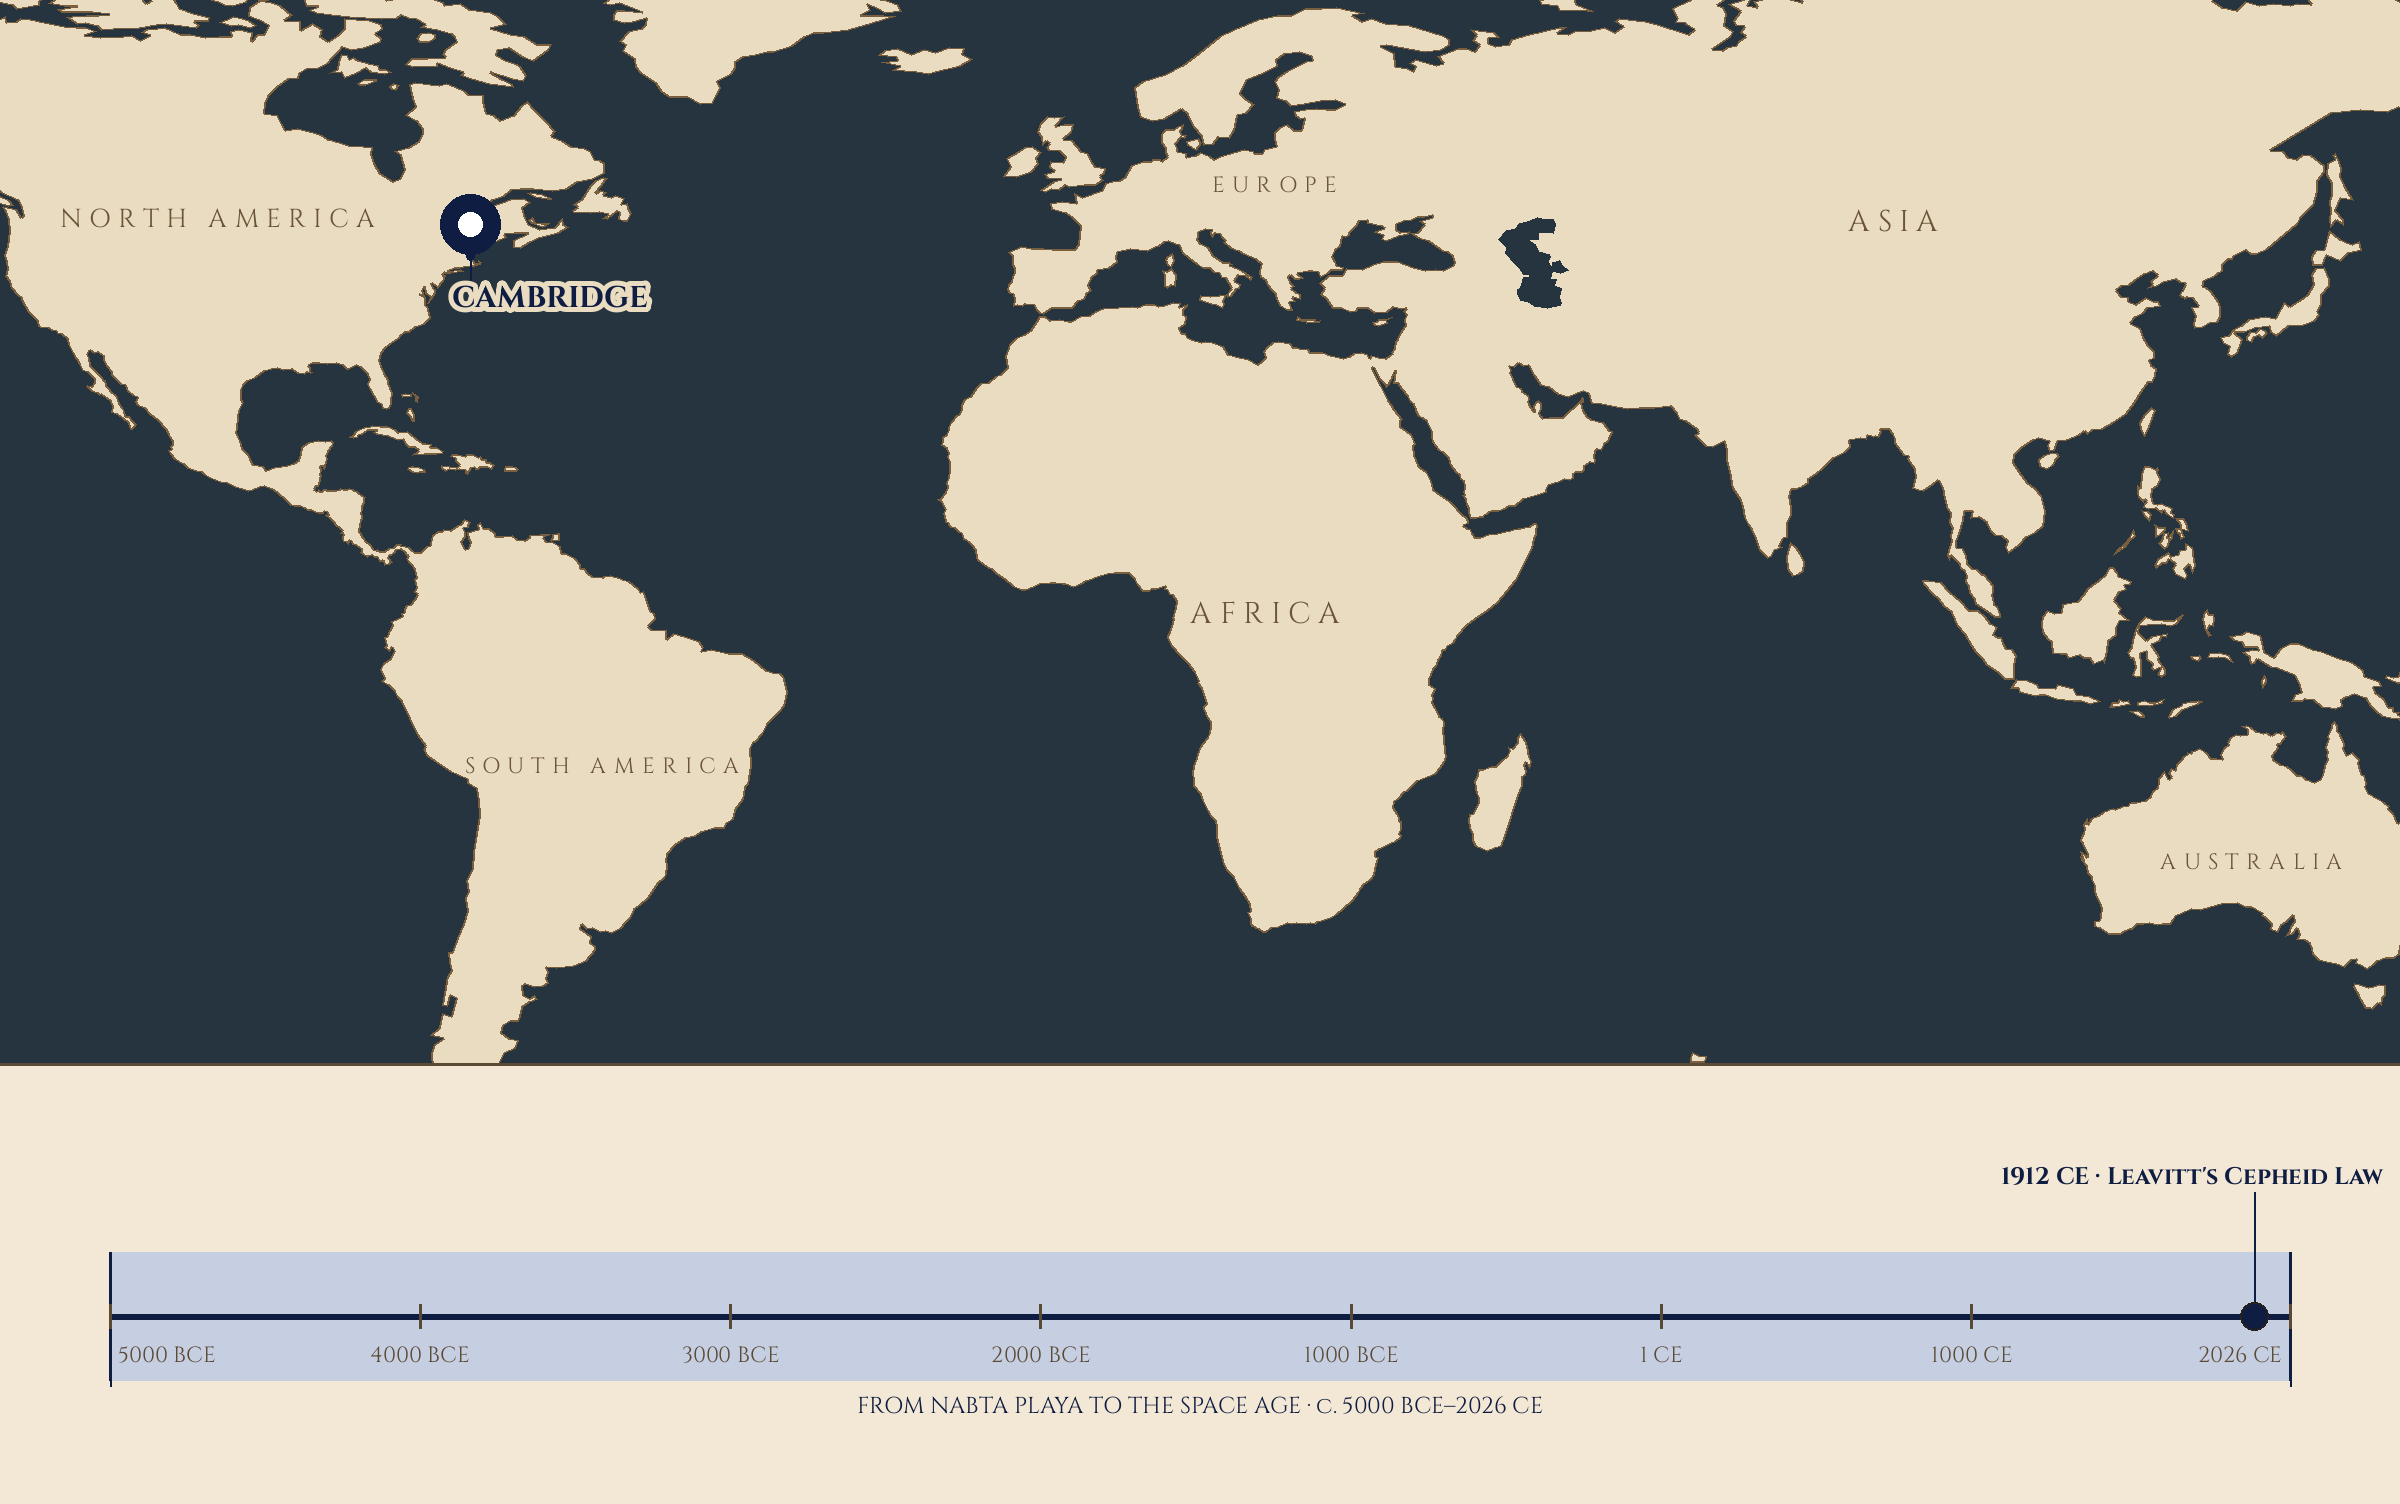
Where and when: CAMBRIDGE, 1912 CE · Leavitt's Cepheid Law (year 1912) — What Stars Are & How Far They Are. The pin is this lesson. The line beneath the map is our road: every stop a moment when watching the sky changed, every lesson a pin upon it.
Lesson Objectives
By the end of this lesson, you will be able to:
- Explain, in their own words, what a star is: a ball of plasma held up by the balance between gravity pulling inward and nuclear fusion pushing outward.
- State the rule that a star's color reveals its surface temperature, and give the order from hottest (blue-white) to coolest (red).
- Describe the basic idea of the Hertzsprung-Russell diagram: a plot of brightness against temperature on which most stars fall along one band, the main sequence.
- Summarize the life cycle of a star like the sun (nebula to white dwarf) and of a massive star (red supergiant to supernova to neutron star or black hole).
- Distinguish apparent magnitude (how bright a star looks) from absolute magnitude (how bright it truly is), and recount the history of the magnitude scale from Hipparchus to Pogson.
- Define parallax, perform the thumb-at-arm's-length demonstration, and explain why parallax fails for distant stars.
- Define the parsec and the light-year, convert between them, and work simple distance calculations.
- Tell Henrietta Leavitt's story and explain how her period-luminosity relation gave astronomers the first standard candle and sized the universe.
Reading this lesson: ★ marks the passages to remember. They return on the unit quiz and the class test. Check in questions ask the material back as you go; answer them in your workbook when you meet them.
Working this lesson: Your assignment packet is the first download on this page. Work in it as the lesson moves along, answering each exercise as its subject is taught — or read the lesson through for your notes and take the exercises as homework afterward. Both are proper ways to sit this class. Signposts in the reading tell you where each exercise belongs. Written answers are short answers in your own words; a few honest lines are worth more than a filled page.
Your Assignment Packet
This lesson's exercises live in its packet: the Lexicon Handout (every term, course terms marked ◆), Materials, Guided Practice, the Assignment Manual with its answer key for self-checking, the Reflection Questions, and the Workbook Checklist. Download the packet before you begin and keep it beside you as you read. The packet's exercises are Glimmerwick's own word for the work: Exercise I — The Parallax Thumb Demo ⚒, Exercise II — Star Colors and Temperatures ✎, and Exercise III — The Gentle Math of Distance ✎. The lesson's quiz is not printed in the packet; it pools to the Unit IV Quiz, where it will meet you again.
Safety Briefing
Night observing tonight. This lesson's practical work happens after dark, so the standing rules apply in full: observe with an adult present, in a familiar and safe location. Tell someone where you are going and when you expect to return. Dress warmly, bring a flashlight, and watch your footing in the dark.
This lesson asks nothing of the sun. You will not look at the sun, aim anything at the sun, or need any solar equipment at all. Every star you study tonight is safely watchable with your unaided eyes. The arithmetic exercises need only paper, a pencil, and patience.
Binoculars and telescopes (Level Two). If you use them, they are for stars only, never for the sun, never near sunrise or sunset when the sun might drift into view.
The Wonder
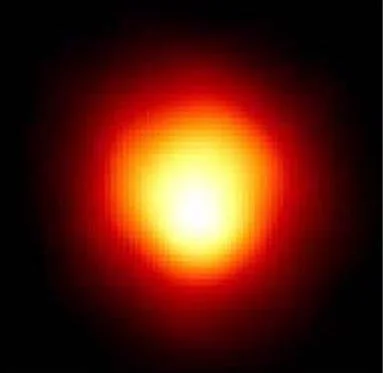
Betelgeuse, the ruddy shoulder of Orion, photographed by the Hubble Space Telescope in 1996 — the first direct image of the surface of a star other than the sun. Its red color is its temperature written in light: cool, for a star, at the end of a massive star's road to supernova.
Andrea Dupree (Harvard-Smithsonian CfA), Ronald Gilliland (STScI), NASA and ESA.
Go outside tonight and look up. Really look. The stars hang there like sparks that forgot to fall, and the strangest thing about them is how flat they look. Your eyes cannot tell that one spark is four light-years away and the next is four thousand. They all seem pinned to the same dark ceiling, as if the universe were a painted dome and we were standing in the middle of the theater.
Now find one red star and one blue-white star. In autumn evenings from the Northern Hemisphere, the red one is easy: Betelgeuse, the ruddy shoulder of Orion, glowing like an ember. A blue-white one is almost overhead: Vega, or the brilliant Sirius low in the winter sky. Look at them side by side. They are not the same color. They are not the same kind of object. They are not even remotely the same distance from you.
Betelgeuse sits about 700 light-years away. The light leaving it tonight (from its point of view) will reach Earth around the year 2700. The light reaching your eyes tonight left Betelgeuse about 700 years ago, when castles were still being built for war and nobody on Earth had any idea what a star was. You are not seeing Betelgeuse as it is. You are seeing Betelgeuse as it was, when Chaucer was a child. Every star you have ever seen is a message from the past, and the farther the star, the older the message.
And here is the wonder inside the wonder: those two stars, the red one and the blue-white one, differ in color for a reason you already understand from ordinary life. You know that the blue-white heart of a candle flame is hotter than its yellow tip, and that a stove burner glows red when it is merely warm and would glow white if it could get hotter. Stars obey the same rule. Color is temperature. The sky is a field of furnaces, and their colors are their thermometers.
Tonight you will learn what the furnaces are made of, how they are born and how they die, and how humanity measured the distance to them. The flat dome will become a deep ocean of fire, and you will never see a flat sky again.
Check in: Betelgeuse and Sirius differ in color and in distance — which of those two differences can your eyes actually judge from looking, and what does the color difference itself tell you?
❦ In your workbook: record the wonder in your own way — the flat dome that is an illusion, Betelgeuse's 700-year-old light, and color read as temperature — copy, sketch, or note what matters.
The Story
The problem nobody could solve
For most of human history, nobody knew how far away the stars were, because nobody had a way to measure it. The ancient Greeks knew the trick in principle: parallax. If Earth really moves around the sun, then a nearby star should appear to shift against the far background as we view it from opposite sides of our orbit, the way your thumb jumps against the far wall when you look at it with one eye and then the other. Some Greek thinkers had even suggested the sun might be the center. But Aristotle and others answered with devastating logic: if Earth moved, we would see the stars shift, and no shift had ever been seen. Therefore, they said, Earth must stand still.
Nearly two thousand years later, Tycho Brahe made the same argument with far better instruments. His naked-eye measurements were the finest ever made, and they showed no stellar parallax at all. The early observers were not stupid. They were exactly right about what they saw. They were wrong only about how far away the stars were, and nobody could imagine distances that large.
❦ In your workbook: record the unsolved problem in your own way — the parallax trick the Greeks already knew, and the honest logic that read no shift as a still Earth — copy, sketch, or note what matters.
1838: the first distances
The dam broke in 1838, and it broke three times at once. Friedrich Bessel in Germany, Thomas Henderson in Scotland (working at the Cape of Good Hope), and Friedrich Struve in Russia independently measured the first stellar parallaxes: Bessel for 61 Cygni, Henderson for Alpha Centauri, Struve for Vega. Bessel published first, in December 1838, announcing that 61 Cygni had a parallax of 0.314 arcseconds. The modern value is 0.287 arcseconds, so Bessel's number was off by less than a tenth, measured with a brass telescope and a human eye, night after night, for over a year.
Stop and feel how small that angle is. One arcsecond is one thirty-six-hundredth of a degree. It is the apparent width of a quarter seen from about five kilometers away. Bessel measured a shift one third of that, in a star, across the sky, using Earth's orbit as his ruler. It was one of the great measurements of the century, and it proved that the stars were not just a little farther than the planets. They were more than a million times farther. The universe got enormously bigger in a single year, and astronomers have been re-measuring it ever since.
Check in: Bessel's 0.314 arcseconds was off the modern value by less than a tenth — what had changed between Aristotle's no-shift argument and 1838: the logic, the instruments, or the imagined distances?
❦ In your workbook: record 1838 in your own way — three measurers at once, the quarter seen from five kilometers, and a universe a million times bigger in a single year — copy, sketch, or note what matters.
What the stars are made of
While the measurers worked on distance, others worked on substance. In the 1800s, astronomers learned to split starlight into spectra, the rainbow barcodes of the elements, and found that stars are made of the same chemical elements as Earth. The sun was not some celestial special substance. It was hot gas, mostly hydrogen, obeying the same physics as everything else.
But what made it shine? In 1920, the English astronomer Arthur Eddington proposed that the sun's energy came from nuclear fusion: atomic nuclei joining together deep in the core, turning a little bit of mass directly into energy. In the late 1930s, the physicist Hans Bethe worked out the detailed chains, the proton-proton chain and the carbon-nitrogen-oxygen cycle, showing exactly how hydrogen fuses into helium inside stars. A star, it turned out, is a controlled, continuous, billion-year explosion, held in perfect balance: gravity squeezing inward, fusion pushing outward, neither winning, for eons.
❦ In your workbook: record the substance in your own way — spectra as barcodes, the same elements as Earth, and Eddington's and Bethe's fusion answer to what makes a star shine — copy, sketch, or note what matters.
Counting brightness: the magnitude story
★ Long before anyone knew what stars were, humans needed to describe how bright they looked. The tradition of sorting naked-eye stars into six magnitudes, the brightest called first magnitude and the faintest sixth, was popularized by Ptolemy in his great star catalog, the Almagest, and is generally believed to have originated with the earlier Greek astronomer Hipparchus. Here the fact-check gate swings wide open, and I will walk you through it honestly: Hipparchus's original catalog is lost, so the attribution cannot be proved. What survives of Hipparchus's own writing uses words like "big" and "small," "bright" and "faint," not numbers. The numbered scale may well predate him. What is certain is that Ptolemy's catalog spread the six-grade system across the ancient world, and astronomers used it, nearly unchanged, for more than fifteen hundred years.
★ In 1856, the English astronomer Norman Pogson put the old scale on a mathematical foundation. He measured real brightnesses and found that first-magnitude stars were, on average, about 100 times brighter than sixth-magnitude stars. He proposed making that exact: a difference of five magnitudes equals a factor of 100 in brightness, which makes one magnitude a factor of about 2.512, the fifth root of 100. That number is called Pogson's ratio, and the modern magnitude scale still runs on it. The scale also runs backward, exactly as the ancients set it: smaller numbers mean brighter objects. Vega sits near magnitude 0, Sirius blazes at negative 1.46, the full moon at negative 12.74, and the sun at negative 26.83.
❦ In your workbook: record the magnitude story in your own way — the six grades, the lost catalog and the honest uncertainty, and Pogson's 100-times rule with its backward-running numbers — copy, sketch, or note what matters.
The H-R diagram
In the early 1900s, two astronomers asked what would happen if you plotted stars' brightness against their temperatures. The Danish astronomer Ejnar Hertzsprung did it in 1911; the American astronomer Henry Norris Russell did it independently in 1913. The result was the Hertzsprung-Russell diagram, and it was not a random scatter. Most stars fell along one great diagonal band, the main sequence. A few sat above it to the right, cool but brilliant, which could only mean they were enormous: the giants. A few sat below it to the left, hot but dim, which could only mean they were tiny: the white dwarfs. The diagram was a map of stellar lives, and astronomers are still reading it.
❦ In your workbook: record the diagram's first appearance in your own way — two astronomers, one diagonal band, and the giants and white dwarfs read off the exceptions — copy, sketch, or note what matters.
The woman who sized the universe

Henrietta Swan Leavitt (1868–1921). She was not allowed to operate the telescopes. From a desk, with glass photographic plates and patience, she found the pattern that sized the universe.
Unknown photographer; published in Popular Astronomy, April 1922 (via the Library of Congress).

The Harvard computers, photographed with Edward Pickering outside the Harvard College Observatory on May 13, 1913. Skilled, meticulous scientists paid by the hour — Leavitt eventually thirty cents, five cents more than most — who did the observatory's science from desks, from glass.
Harvard College Observatory (Harvard College Observatory History in Images).
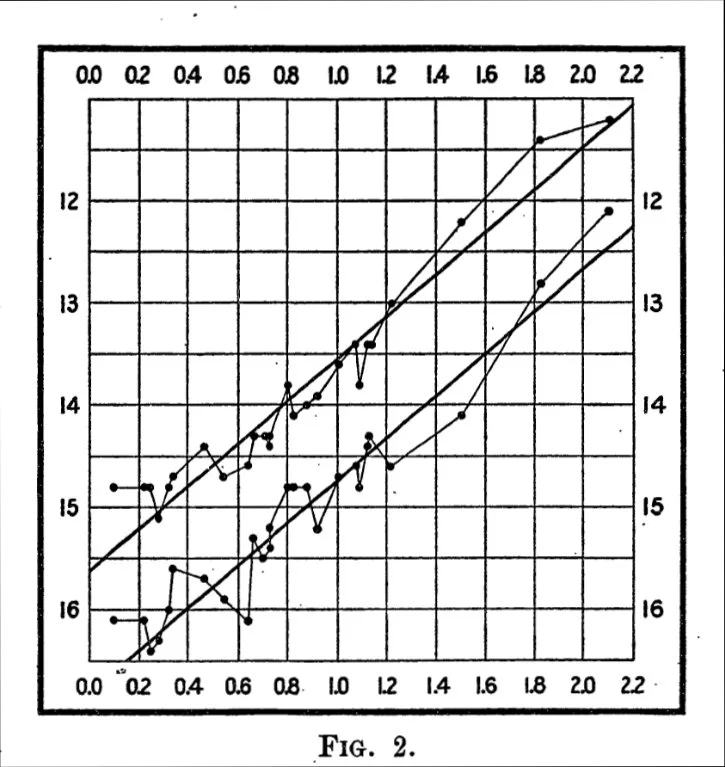
Figure 2 of Circular 173 (1912), Leavitt's own graph: brightness against the logarithm of period for 25 Cepheids of the Small Magellanic Cloud. Two series of points, two straight lines. "A straight line can be readily drawn among each of the two series of points" — and with it, the universe got a ruler.
Henrietta S. Leavitt & Edward C. Pickering, Harvard College Observatory Circular 173 (1912).
Now the story this lesson has been walking toward.
Henrietta Swan Leavitt was born in Lancaster, Massachusetts, in 1868. She graduated from Radcliffe College in 1892 and, with few professional paths open to a woman of science, volunteered at the Harvard College Observatory. The observatory's director, Edward Pickering, had assembled a team of women to examine the observatory's enormous collection of glass photographic plates and catalog the stars on them. These women were called computers. They were skilled, meticulous scientists, and they were not allowed to operate the telescopes. The data came to them on glass, and they did the science from their desks. Leavitt eventually earned thirty cents an hour, five cents more than most of the other computers, for work that would reshape cosmology.
★ Pickering assigned Leavitt the variable stars of the Small and Large Magellanic Clouds, photographed with the observatory's station in Arequipa, Peru. She found 1,777 variable stars. And among them, in the Cepheid variables, stars that swell and shrink in a regular heartbeat of days or weeks, she found a pattern. In 1908 she published her first results in the Annals of the Harvard College Observatory, noting that the brighter variables had the longer periods. In 1912 she published the full relation in Harvard College Observatory Circular 173: a graph of brightness against the logarithm of period, with the points falling along a clean straight line. The paper was signed by Pickering, as was the custom, but its first sentence states plainly that it was prepared by Miss Leavitt.
★ Here was her genius, and it was a genius of reasoning, not of equipment. She did not know how far away the Small Magellanic Cloud was. Nobody did. But she realized it did not matter: all of its stars were roughly the same distance from Earth, so if the brighter Cepheids had longer periods as seen from Earth, they must truly be brighter in themselves. Period revealed true brightness. And once you know a star's true brightness, you can find its distance by comparing that with how bright it looks, because light dims with distance in a known way.
There was one missing piece: the scale. Leavitt's relation said "this star is brighter than that one" but not "this star is exactly this bright." The calibration came when astronomers measured distances to nearby Cepheids by parallax. Ejnar Hertzsprung made the first calibration in 1913. With it, any Cepheid anywhere became a measuring stick. Astronomers had their first standard candle, a star whose true brightness is known, usable far beyond the reach of parallax.
The consequences were enormous. Harlow Shapley used the relation in 1918 to map the globular clusters and showed the Milky Way was far larger than anyone had thought, with the sun nowhere near its center. Then Edwin Hubble found Cepheids in the Andromeda Nebula in 1923 and 1924, measured their distances with Leavitt's law, and showed that Andromeda lay far outside the Milky Way. The "spiral nebulae" were separate galaxies. The universe was not one galaxy. It was galaxies beyond counting. Leavitt's discovery had settled the Great Debate over the size of the universe.
Henrietta Leavitt died of stomach cancer on December 12, 1921, at the age of 53, before the full impact of her work was understood. In 1924, the Swedish mathematician Gosta Mittag-Leffler tried to nominate her for the Nobel Prize in Physics, not knowing she had died three years earlier. The prize is not awarded posthumously. Hubble himself often said she deserved it. She never looked through a telescope. She measured the universe from photographs of light, with patience and a straight line drawn through points of data.
Check in: Leavitt did not know the Small Magellanic Cloud's distance — so why could she still conclude that longer-period Cepheids are truly brighter, not just brighter-looking?
❦ In your workbook: record Leavitt in your own way — the computers and the glass plates, the straight line of 1912, the calibration that made a measuring stick, and the universe it sized — copy, sketch, or note what matters.
The Mechanism
What a star is
A star is a ball of plasma, gas so hot that its atoms have been stripped of their electrons, held together by its own gravity. At its center, the pressure and temperature are so extreme that hydrogen nuclei fuse into helium, and a tiny fraction of their mass becomes energy. That energy streams outward, and its pressure holds the star up against the gravity trying to crush it. Astronomers call this balance hydrostatic equilibrium: squeeze versus shine, in a standoff that lasts millions or billions of years.
★ Almost every star you will ever see is doing exactly this one thing: fusing hydrogen in its core, the way the sun is doing right now. The sun turns about 600 million tons of hydrogen into helium every single second, and the mass it loses as energy is what warms your face on a summer day, eight minutes after it left the sun's surface.
❦ In your workbook: record what a star is in your own way — plasma held up by the squeeze-versus-shine standoff, and the sun's 600 million tons a second — copy, sketch, or note what matters.
Color is temperature
Hold the thought of a candle flame. Its outer edges glow yellow-orange; its heart, right at the wick, burns blue-white. The blue-white part is hotter. A blacksmith's iron glows red when it is warm, orange when it is hotter, and yellow-white when it is hotter still. Hotter things glow bluer. This is one of the most useful rules in all of astronomy, and it works for stars exactly as it works for flames.
★ Stars follow the same order. The coolest stars glow red, at surface temperatures around 3,000 Kelvin. Stars like our sun glow yellow-white, at about 5,800 Kelvin. The hottest stars blaze blue-white, at 10,000 Kelvin and far beyond, some past 30,000. Astronomers sort stars into spectral types, hottest to coolest: O, B, A, F, G, K, M. Our sun is a G-type star, comfortably in the middle of the stellar population, yellow-white and steady.
So when you look at Betelgeuse glowing red and Sirius blazing blue-white, you are reading their temperatures the way you would read a thermometer. Red means cool. Blue-white means ferociously hot. The color you see is the surface temperature, written in light.
Check in: A star glows red and another glows blue-white — which is hotter, and where does our yellow-white sun fall in the O-to-M order?
❦ In your workbook: record color as temperature in your own way — the candle flame and the blacksmith's iron, the 3,000-to-30,000 Kelvin run, and the O B A F G K M order with the sun at G — copy, sketch, or note what matters.
The H-R diagram, kept simple
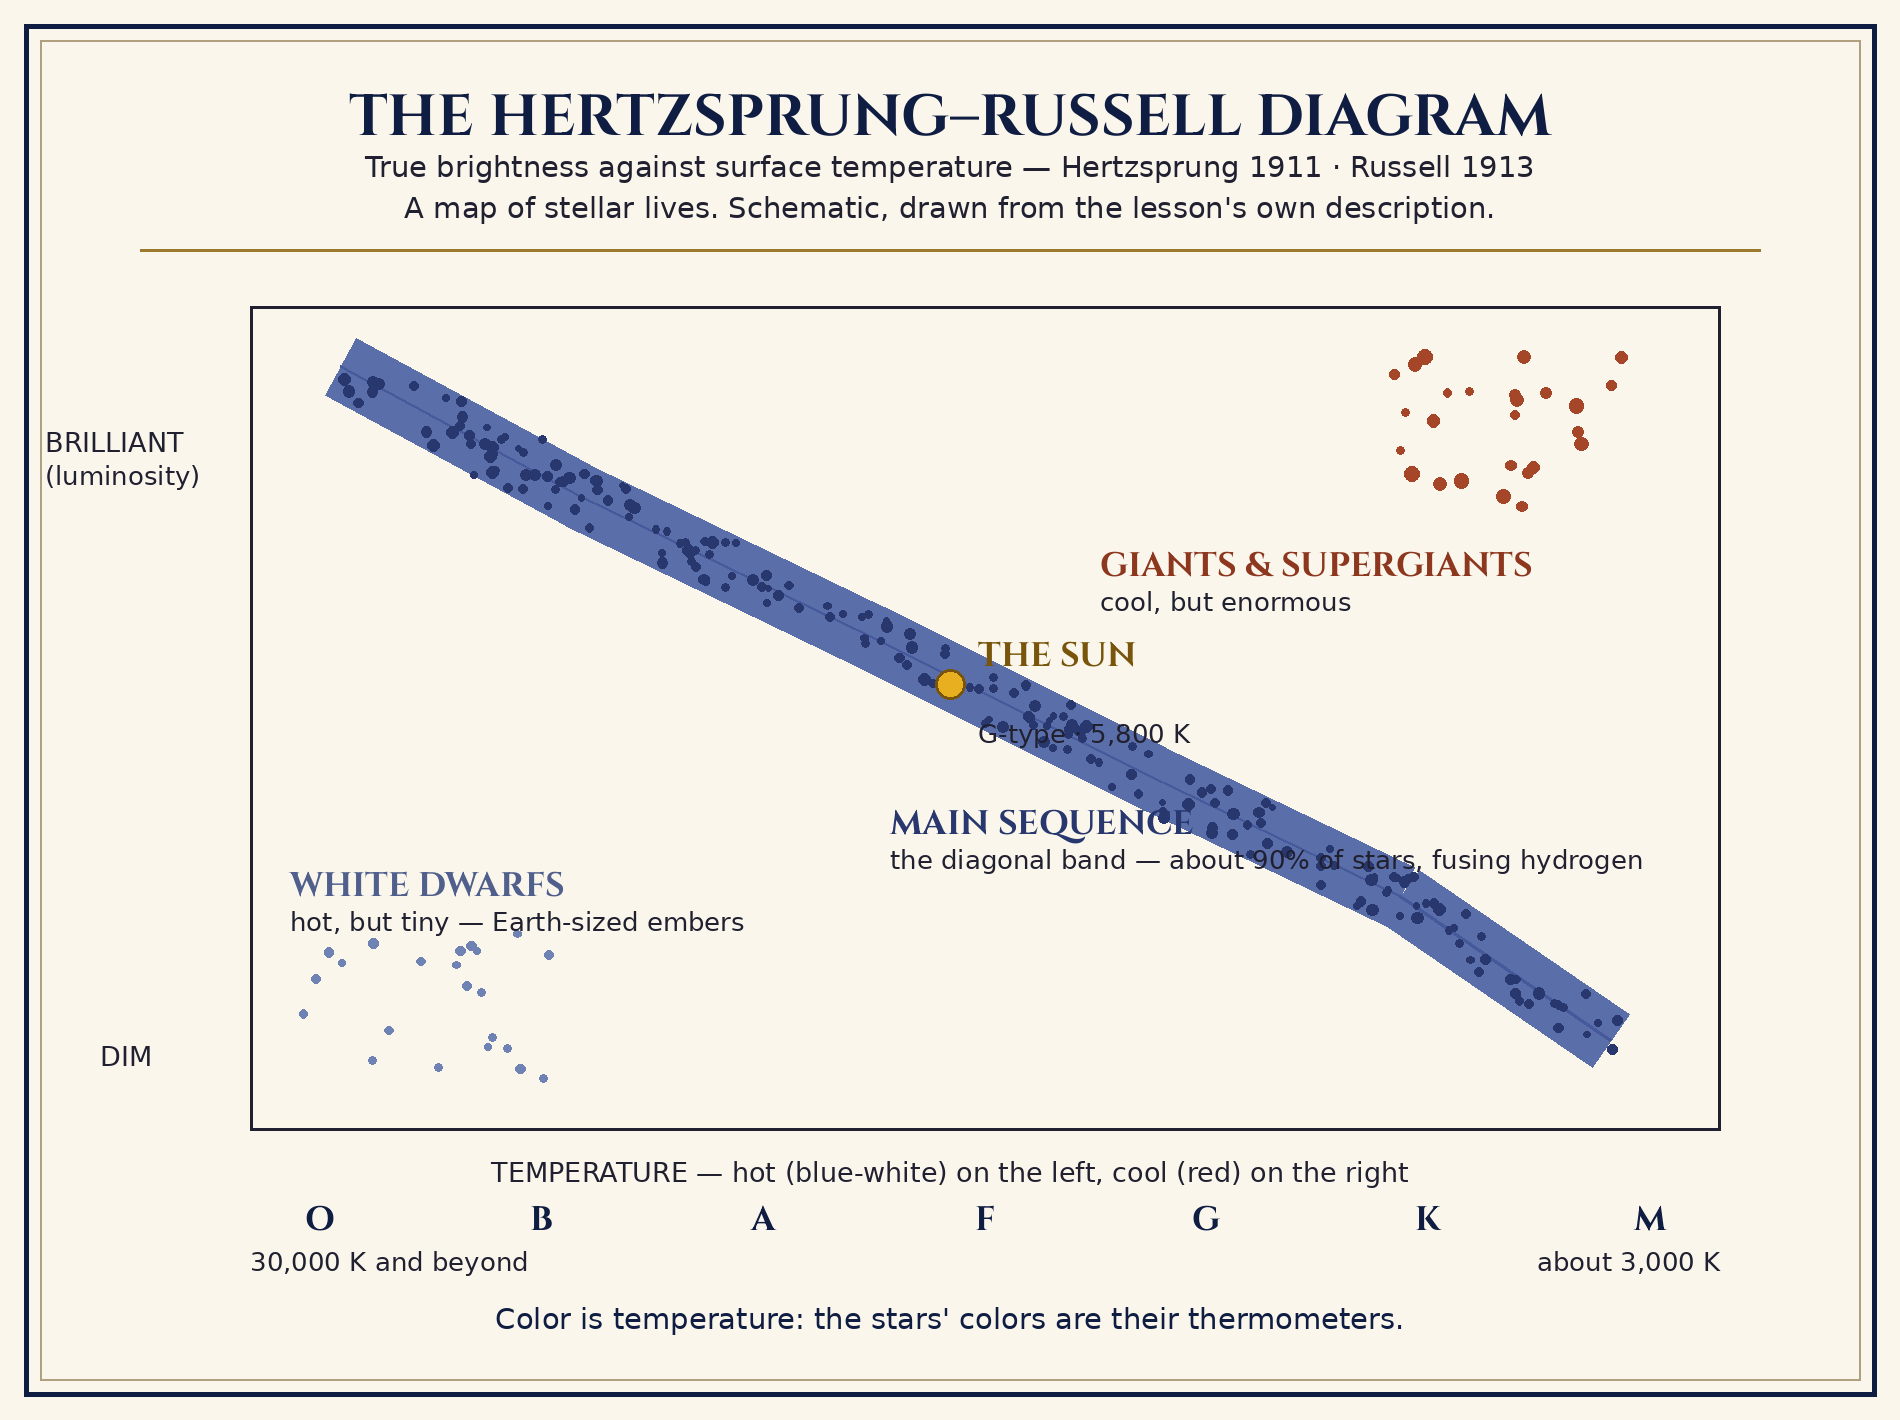
The Hertzsprung–Russell diagram, schematic: true brightness plotted against surface temperature. Most stars fall along the main sequence; the cool-but-brilliant giants sit upper right, the hot-but-tiny white dwarfs lower left, and the sun sits mid-band, exactly where a middle-aged G-type star should be.
Built digitally for this overhaul (Python/PIL, typeset labels), from the mechanism taught in the lesson text.
Now imagine plotting every star on one chart: temperature (or color) along the bottom, from hot on the left to cool on the right, and true brightness (luminosity) up the side, from dim at the bottom to brilliant at the top. That chart is the Hertzsprung-Russell diagram, and its shape tells the life story of stars.
★ Most stars, about ninety percent, fall along one diagonal band running from the hot bright upper left to the cool dim lower right. This is the main sequence: stars in the prime of life, steadily fusing hydrogen in their cores. The sun sits on the main sequence, a middle-aged G-type star, exactly where it should be.
Above the main sequence to the right sit the giants and supergiants: cool in color, but enormously bright. There is only one way a cool star can outshine thousands of suns: it must be gigantic, with a vast surface area radiating light. Below the main sequence to the left sit the white dwarfs: hot, but dim, which means they must be tiny, Earth-sized embers of collapsed stellar cores.
Think of it the way the textbook authors do: it is like a chart of human height and weight. Most people fall along one band, taller people generally heavier. But the exceptions tell you something real: the short, very heavy person and the tall, very light one are genuinely different kinds of bodies. On the H-R diagram, the exceptions are genuinely different kinds of stars, at different stages of their lives.
Check in: A cool star sits far above the main sequence, outshining thousands of suns — what must be true of its size, and which group does it belong to?
❦ In your workbook: record the H-R diagram in your own way — the axes, the ninety-percent band, and what the upper-right and lower-left exceptions must be — copy, sketch, or note what matters.
In your packet: Exercise II — Star Colors and Temperatures ✎ draws on this chart — its red-giant question is answered from exactly this reasoning. Work it now, or mark the place and take it as homework — your choice.
How stars live and die
Every star begins the same way: as a cold cloud of gas and dust, a stellar nebula, slowly collapsing under its own gravity. The collapsing ball at this stage — glowing from the collapse, but not yet fusing hydrogen — is a protostar. When the center grows hot enough, the collapse ignites it: hydrogen fusion begins, and a star is born onto the main sequence. What happens next depends almost entirely on one thing: mass.
★ Stars like the sun, and smaller. The sun has been fusing hydrogen for about 4.6 billion years and has roughly another 5 billion to go. When its core hydrogen runs out, the core will contract and heat while the outer layers swell enormously: the sun will become a red giant, large enough to swallow the inner planets. Then the swollen atmosphere drifts away into space, forming a glowing shell called a planetary nebula (a historical misnomer: it has nothing to do with planets), and the leftover core remains as a white dwarf, a hot Earth-sized ember that cools slowly over billions of years. This is the quiet ending, and it is the fate of the vast majority of stars.
Massive stars. Stars born with many solar masses — the sun's mass, astronomy's unit for weighing stars — burn hotter, faster, and die young, in millions of years rather than billions. They swell into red supergiants, like Betelgeuse, and fuse progressively heavier elements in their cores: helium, carbon, oxygen, all the way to iron. Iron cannot be fused for energy, so when the core becomes iron, the game ends suddenly. The core collapses in seconds, the outer layers rebound off it and explode outward in a supernova, briefly outshining an entire galaxy. What remains depends on the leftover mass: a neutron star, a city-sized ball of matter so dense a teaspoon would weigh billions of tons, often spinning and pulsing as a pulsar; or, for the heaviest cores, a black hole, where gravity has won completely and nothing, not even light, escapes.
Mass is destiny. Small stars live long and die quietly. Massive stars live fast and die spectacularly, seeding space with the heavy elements their furnaces forged. Every atom of iron in your blood, every atom of calcium in your bones, was cooked inside a massive star that died before the sun was born. You are, in the most literal sense, made of stardust, and this lesson can say so without a shred of mysticism, because the physics is real.
❦ In your workbook: record the two life stories in your own way — nebula to white dwarf for the sun-like, red supergiant to supernova to neutron star or black hole for the massive, and mass as destiny — copy, sketch, or note what matters.
Apparent versus absolute magnitude
Here is a riddle. A candle across the room looks dimmer than a bonfire on a far hill, but which one is truly brighter? You cannot tell from looking. How bright something looks depends on two things: how bright it truly is, and how far away it is. Astronomers needed separate words for these, and they have them.
Apparent magnitude is how bright a star looks from Earth. This is the magnitude of the ancient scale, the one Hipparchus may have originated and Ptolemy popularized, the one Pogson mathematized in 1856. Sirius has an apparent magnitude of negative 1.46, the brightest star in our sky. But Sirius is not the brightest star. It is merely close, about 8.6 light-years away.
★ Absolute magnitude is how bright a star would look if you placed it at a standard distance: 10 parsecs, about 33 light-years. Absolute magnitude measures the star's true power output, its luminosity, on the same backward logarithmic scale. This is why the distinction matters: a dim-looking star might be a true giant very far away, and a brilliant-looking star might be an ordinary star quite close. Betelgeuse looks modestly bright to your eye, but its absolute magnitude reveals a supergiant thousands of times more luminous than the sun.
The two magnitudes are connected by distance, and that connection is the whole game of this lesson's second half.
❦ In your workbook: record the two magnitudes in your own way — the candle and the bonfire, Sirius close rather than supreme, and the 10-parsec standard — copy, sketch, or note what matters.
Parallax: the thumb trick that measured the sky
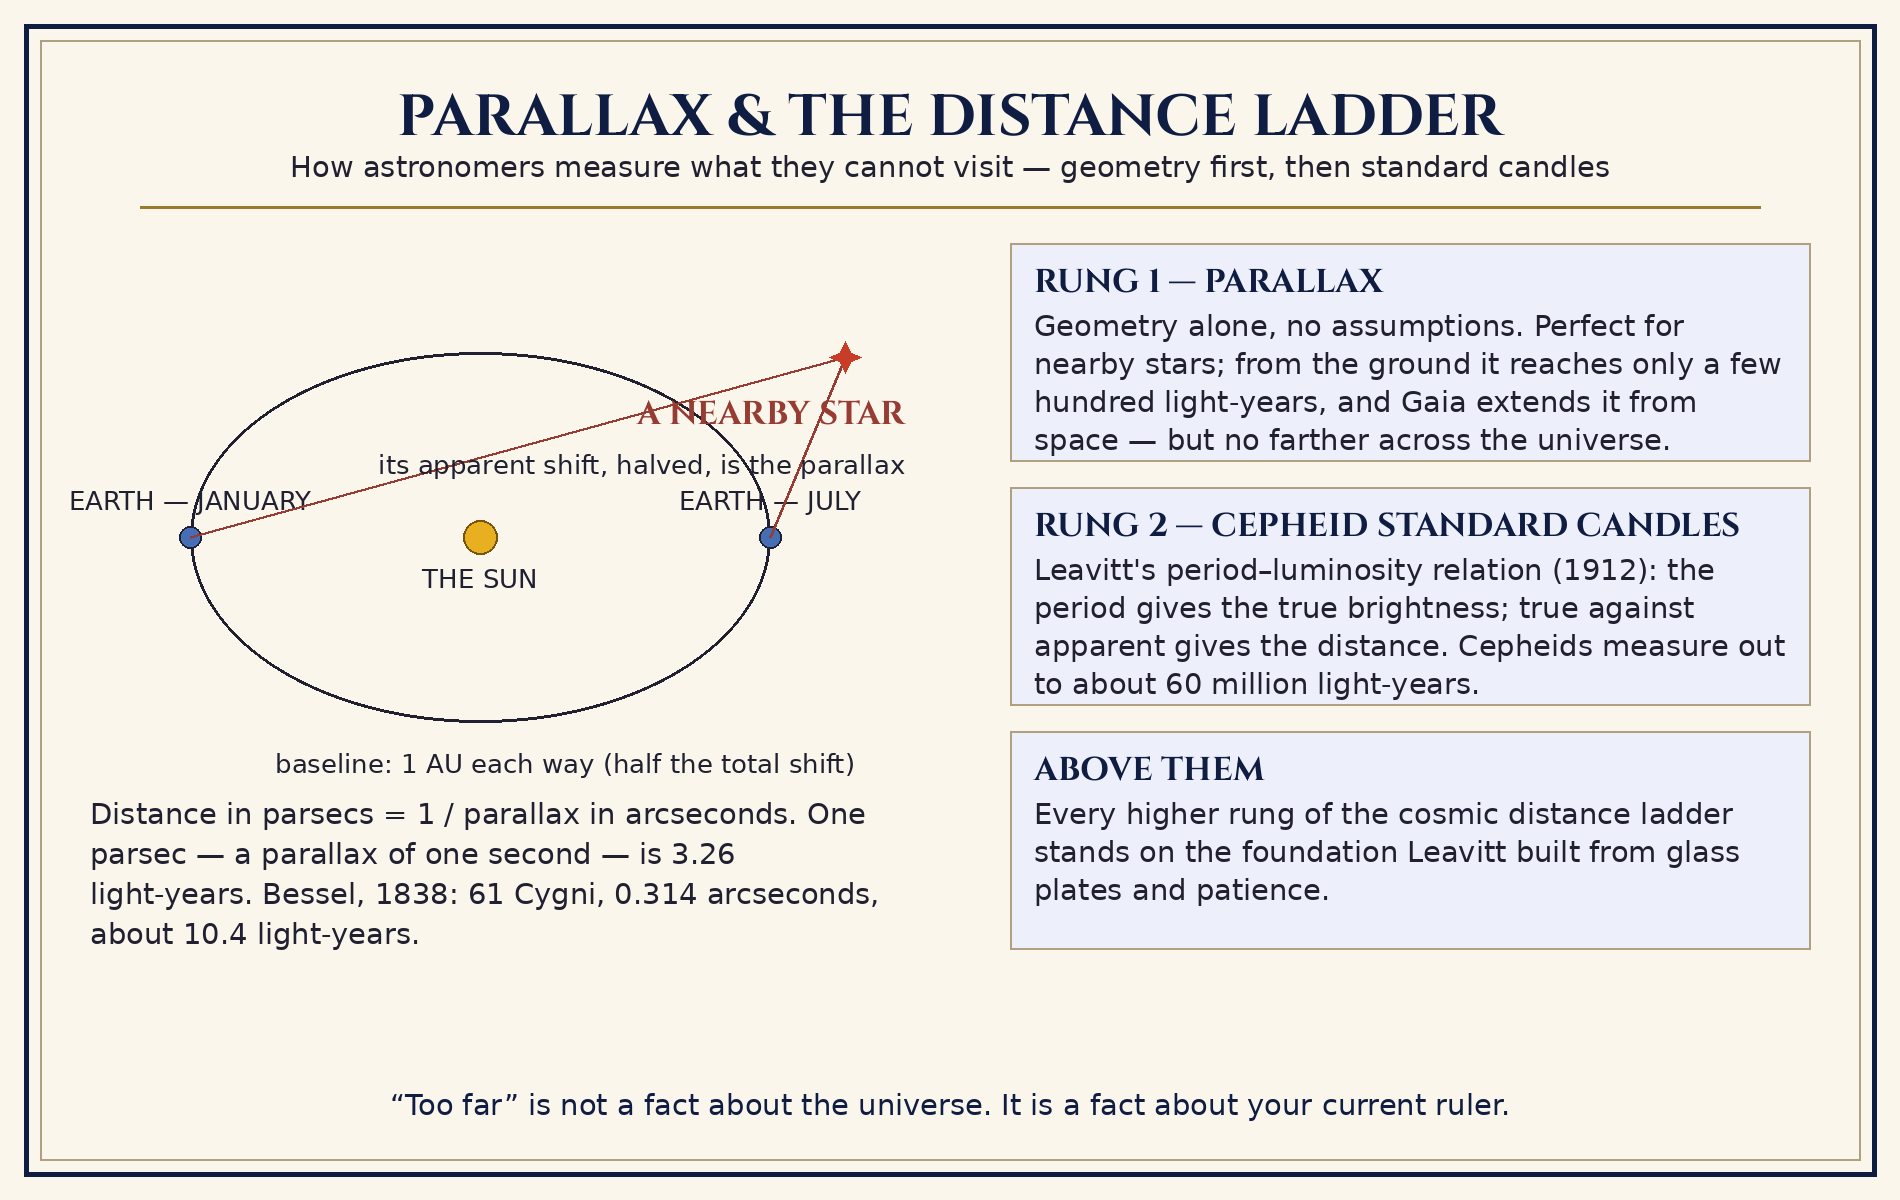
Parallax and the distance ladder: Earth's orbit as the baseline, half the total shift as the parallax, the parsec defined by one arcsecond — and above parallax, Leavitt's Cepheids, the first standard candles, carrying measurement millions of times farther.
Built digitally for this overhaul (Python/PIL, typeset labels), from the mechanism taught in the lesson text.
Hold your thumb up at arm's length. Close your left eye, then your right, alternating. Your thumb appears to jump back and forth against the far wall. Now bring your thumb closer to your face and repeat: the jump gets bigger. Move it farther: the jump gets smaller. That jump is parallax, the apparent shift of a nearby object against a distant background when viewed from two different positions.
Astronomers do exactly this, with Earth's orbit as their arm. They photograph a nearby star in, say, January, when Earth is on one side of the sun, and again in July, when Earth is on the opposite side. The star appears to shift against the far background stars. By convention, parallax is defined as half the total shift, which corresponds to a baseline of one astronomical unit, the Earth-sun distance, rather than two.
The shift is absurdly small. Even for the nearest stars it is a fraction of an arcsecond, that quarter-seen-from-five-kilometers unit. That is why Bessel's 1838 measurement was such a triumph, and why nobody could do it before telescopes and precision instruments existed.
★ From parallax comes the astronomer's favorite unit of distance, the parsec. One parsec is the distance at which a star would show a parallax of exactly one arcsecond. The word itself is a contraction: parallax of one second. One parsec equals 3.26 light-years, and the conversion is beautifully simple: a star's distance in parsecs is one divided by its parallax in arcseconds. A parallax of 0.1 arcseconds means 10 parsecs. A parallax of 0.05 means 20 parsecs.
Check in: Why is parallax defined as half the total shift — what baseline does the half correspond to? And a star with a parallax of 0.2 arcseconds is how many parsecs away?
❦ In your workbook: record parallax in your own way — the jumping thumb, January against July, the half-shift convention and its one-AU baseline, and the parsec's one-divided-by rule — copy, sketch, or note what matters.
In your packet: Exercise I — The Parallax Thumb Demo ⚒ begins here — its paragraph asks exactly why the half, and its calculation redoes Bessel's with the modern value. Work it now, or mark the place and take it as homework — your choice.
Why parallax runs out
★ Parallax is perfect, direct, and geometric. It needs no assumptions about what stars are. But it has a hard limit: the farther the star, the smaller the angle, and angles eventually shrink below what any instrument can measure. From the ground, parallax reaches only a few hundred light-years with useful accuracy. The Gaia space observatory, measuring from above the atmosphere, has extended precise parallaxes to hundreds of millions of stars, but even Gaia cannot parallax its way across the universe. For the deep sky, astronomers needed a different kind of ruler.
❦ In your workbook: record the limit in your own way — the shrinking angle, the few hundred light-years from the ground, and why even Gaia cannot finish the job — copy, sketch, or note what matters.
Standard candles: Leavitt's ladder
Imagine you are walking at night and see a streetlamp glowing in the distance. If you know that all streetlamps of that model put out the same light, you can judge how far away it is by how dim it looks. A star whose true brightness is known is called a standard candle, and Leavitt's Cepheids were the first.
The logic runs in three steps. First, measure the Cepheid's pulsation period, which is easy: watch it brighten and dim and time the cycle. Second, use Leavitt's period-luminosity relation to find its true brightness: longer period means truly brighter. Third, compare true brightness with apparent brightness. Light dims with distance in a known way (double the distance, quarter the brightness), so the comparison gives the distance. Henrietta Leavitt gave astronomy a ruler that worked millions of times farther than parallax ever could. Cepheids measure distances out to about 60 million light-years, and every rung of the cosmic distance ladder above them, out to the edge of the observable universe, stands on the foundation she built from glass plates and patience.
❦ In your workbook: record the ladder's logic in your own way — period first, true brightness second, the comparison third, and the 60-million-light-year reach — copy, sketch, or note what matters.
The arithmetic, worked gently
Two units do all the work in this lesson. Here they are, with the math done slowly.
The light-year. Light travels at about 300,000 kilometers per second. A light-year is simply the distance light covers in one year. Multiply it out:
300,000 km/s x 60 seconds = 18,000,000 km per minute x 60 minutes = 1,080,000,000 km per hour x 24 hours = 25,920,000,000 km per day x 365 days = about 9,460,800,000,000 km per year
One light-year is roughly 9.46 trillion kilometers. It is a unit of distance, not time, despite the name. Saying a star is 4 light-years away is the same kind of statement as saying a town is a 4-hour drive away: it tells you the distance by telling you the travel time.
Light travel time. The nearest star beyond the sun, Proxima Centauri, is 4.2465 light-years away. How long does its light take to reach us? The unit answers its own question: 4.2465 years, about 4 years and 3 months. When you look at Proxima Centauri tonight, you see it as it was more than four years ago.
The parsec. One parsec is 3.26 light-years. To convert, multiply or divide by 3.26. A star 10 parsecs away is 32.6 light-years away. A star 100 light-years away is about 30.7 parsecs away (100 divided by 3.26).
Parallax to distance. Distance in parsecs equals 1 divided by parallax in arcseconds. Bessel measured 61 Cygni's parallax as 0.314 arcseconds. So its distance is 1 / 0.314 = about 3.18 parsecs. Multiply by 3.26 to get light-years: about 10.4 light-years. That is exactly what Bessel announced in 1838, and the modern value, 11.4 light-years, shows how close he came.
A Cepheid example. Suppose you find a Cepheid with a pulsation period of 10 days, and Leavitt's relation tells you its true brightness is 10,000 times the sun's. It looks 100 million times dimmer than it truly is. Brightness dims with the square of distance, so the dimming factor of 100,000,000 means the distance factor is the square root: 10,000. The star is 10,000 times farther than the standard distance used for true brightness. This is the whole distance ladder in miniature: period gives true brightness, true brightness compared with apparent brightness gives distance.
❦ In your workbook: record the gentle arithmetic in your own way — the light-year multiplied out, the 3.26 conversions both ways, Bessel's 1 / 0.314 worked through, and the Cepheid square root — copy, sketch, or note what matters.
In your packet: Exercise III — The Gentle Math of Distance ✎ begins here — its five problems are this arithmetic, worked by your own hand. Work it now, or mark the place and take it as homework — your choice.
A Sealed Note on Measuring
Scholars, I want you to notice something about tonight's lesson, because it is the kind of thing that is easy to miss while you are busy learning.
Every distance in this lesson was measured by someone who could not go there. Bessel never visited 61 Cygni. Leavitt never visited the Small Magellanic Cloud. Nobody will ever visit Betelgeuse. All of it, every number, was worked out from here, from light that fell into eyes and instruments on one small planet, combined with geometry and patience and the refusal to accept "too far to know" as an answer.
There is a lesson inside the lesson, and it is this: "too far" is not a fact about the universe. It is a fact about your current ruler. When the ruler is too short, you do not declare the distance unknowable. You build a longer ruler. Parallax was a ruler. Leavitt's Cepheids were a longer one. Someone in your generation will build the next.
Keep your pencil sharp.
❦ In your workbook: record the sealed note in your own way — every number worked out from here, "too far" as a fact about the ruler, and the longer ruler your generation will build — copy, sketch, or note what matters.
PROFESSOR VESPER GLIMMERWICK
Celestial Studies
Astronomer & Celestial Historian
Guided Observation
Try It Tonight
Part One: The Parallax Demo
Do the thumb experiment from the lesson, and do it properly, because you are about to feel what Bessel felt.
- Go outside or stand facing a distant object, a tree, a building, anything far away.
- Hold your thumb up at arm's length. Close one eye, note where your thumb sits against the background. Switch eyes. Watch it jump.
- Now move your thumb to half the distance and repeat. The jump is bigger. Move it to twice arm's length if you can. The jump is smaller.
- In your Sky Log, sketch what you saw and write one sentence explaining why closer objects show larger parallax. Then write a second sentence explaining why Bessel needed Earth's whole orbit as his baseline instead of his two eyes.
Level Two: if you have binoculars, try the demo on a distant chimney or treetop and notice how much smaller the jump becomes. Imagine shrinking it ten thousand times. That was Bessel's measurement.
❦ In your workbook: record the demo in your own way — the sketch of the jump near and far, and your two sentences on closer objects and on Bessel's baseline — copy, sketch, or note what matters.
In your packet: Exercise I — The Parallax Thumb Demo ⚒ grows out of this demo — the Sky Log sketch is its first step. Work it now, or mark the place and take it as homework — your choice.
Part Two: Reading Star Colors
Find three stars of clearly different colors. Good autumn targets from the Northern Hemisphere: Betelgeuse (red-orange, in Orion), Aldebaran (orange, in Taurus), and Vega or Sirius (blue-white). From the Southern Hemisphere: Betelgeuse still serves for red, and Canopus or Sirius for blue-white.
For each star, record in your Sky Log: its name, its constellation, its color in your own words, and whether you judge it hotter or cooler than the sun based on tonight's lesson. Then find the moon if it is up and note its color too. The moon shines by reflected sunlight, so its color is a roundabout reading of the sun's: what does that tell you about the sun's temperature class?
Check in: The moon shines by reflected sunlight — so what does its color tell you about the sun's own temperature class?
❦ In your workbook: record the colors in your own way — your three stars in your own words, hotter or cooler than the sun, and the moon note — copy, sketch, or note what matters.
In your packet: Exercise II — Star Colors and Temperatures ✎ begins here — its first step is this three-star table, completed. Work it now, or mark the place and take it as homework — your choice.
Part Three: The Gentle Arithmetic
Work these on paper, showing each step the way the lesson did. There are no tricks. Calculators are welcome.
- Compute the length of a light-year in kilometers, starting from 300,000 km/s. Show the multiplications for seconds to minutes to hours to days to years.
- A star has a parallax of 0.25 arcseconds. How far away is it in parsecs? In light-years?
- A star is 65 light-years away. How many parsecs is that? How long has its light been traveling to reach you?
- Betelgeuse is about 700 light-years distant. Roughly what year was it, on Earth, when the light you see tonight left Betelgeuse? (Tonight is 2026.)
- A Cepheid's period tells you its true brightness is 1,000,000 times the sun's, but it appears 10 billion (10,000,000,000) times dimmer than that. What is the square root of the dimming factor, and what does it tell you about the star's relative distance?
❦ In your workbook: record the arithmetic in your own way — each problem worked with its steps showing, the way the lesson worked its own — copy, sketch, or note what matters.
In your packet: Exercise III — The Gentle Math of Distance ✎ begins here — its first step is these five problems, completed. Work it now, or mark the place and take it as homework — your choice.
Sky Log Entry
Date, time, and location:
Parallax demo sketch: (draw your thumb's two positions against the background, near and far)
Three stars of different colors:
| Star | Constellation | Color (your words) | Hotter or cooler than the sun? |
|---|
Moon note: (phase, color, and what its color tells you about the sun)
One thing that surprised me tonight:
❦ In your workbook: record the Sky Log entry in your own way — the demo sketch, the three-star table, the moon note, and the one thing that surprised you — copy, sketch, or note what matters.
Materials
Required (Level One — household items)
- Your own thumb and two eyes for the parallax demonstration.
- A distant background object (a tree, a building, anything far away) to watch your thumb jump against.
- Your workbook, the Sky Log, and a pencil for the sketches, the star-color table, and the arithmetic.
- A calculator for the gentle math (welcome, not cheating).
- A flashlight for night observing.
Suggested (Level Two — historically closer)
- Binoculars or a small telescope for the Level Two parallax demo and star-color observing (stars only, never the sun).
- A red-filter or dim flashlight for preserving night vision while logging.
Reflection Questions
Answer each in a few thoughtful sentences. There are no trick questions; there are only interesting ones.
- For two thousand years, intelligent observers saw no stellar parallax and concluded Earth stood still. Were they being unscientific? What does this story tell you about the difference between good reasoning and complete information?
- Henrietta Leavitt was not allowed to operate a telescope, yet she made one of the most important discoveries in astronomy. What does her story suggest about where scientific discoveries actually come from?
- The magnitude scale runs backward: smaller numbers mean brighter stars. If you were redesigning astronomy from scratch, would you keep the historical system or start fresh? What would be gained and lost?
- Every atom of iron in your blood was forged inside a massive star that died before the sun was born. Does knowing the mechanism behind that statement change how it feels? Why or why not?
- Parallax measures distance directly from geometry. Standard candles measure it indirectly, through a chain of reasoning. Which kind of measurement do you trust more, and what would it take to shake that trust?
Workbook Checklist — Lesson 19
In my workbook I have:
- ☐ done the parallax thumb demo and sketched both thumb positions, near and far, in my Sky Log
- ☐ written my two sentences: why closer objects show larger parallax, and why Bessel needed Earth's whole orbit as his baseline
- ☐ completed the three-star color table and the moon note, and judged each star hotter or cooler than the sun
- ☐ worked all five gentle-arithmetic problems on paper, showing every step
- ☐ written Exercise I's half-shift paragraph, recomputed 61 Cygni with the modern parallax, and written my three Andromeda sentences
- ☐ written Exercise II's spectral sequence and red-giant explanation, and Exercise III's Leavitt chain paragraph
☐ Lesson completed Date: ___ Signature: ___
The Professor's Closing Note
And so the dome becomes an ocean, scholars.
You came outside tonight and saw what every human who ever lived has seen: lights on a dark ceiling. You go back inside knowing what almost no human who ever lived has known: that the ceiling is an illusion, that each light is a furnace with a temperature you can read from its color, a life story you can read from its place on a diagram, and a distance you can measure with geometry, with patience, and with the heartbeat of a pulsing star.
Remember Henrietta Leavitt the next time someone tells you that a door is closed. The telescopes were closed to her. She measured the universe from a desk, through glass, with a straight line. Doors close. Windows open. Sometimes the window is a photographic plate, and sometimes it is a lesson, and sometimes it is simply the decision to keep looking.
I will see you in the tower. I am the bat circling the lamp outside your window, and I mean that fondly.
PROFESSOR VESPER GLIMMERWICK
Celestial Studies
Astronomer & Celestial Historian
Cross-Class Connections

Runes · Unit I, Lesson 1 — The Structural Wedge
Tower scholars, tonight you measured the distances to the things the tablets recorded. Come down to the Runes Classroom and learn the recording itself, from its first wedge: how Sumerian accountants pressed shaped tokens and a reed stylus into wet clay, and how those wedges became cuneiform — the writing the Babylonians used to keep the sky's motions for a thousand years. Professor Glimmerwick reads what the records mean. Here, we read the tablets.
PROFESSOR THISTLELOOM WEBBLETHORN
Runes & Ancient Writing

Scrollwork · Unit VI, Lesson 23 — Archive Labels & Library Systems
Tower scholars, tonight's numbers began as entries in a list. Ptolemy's Almagest carried the six grades of brightness from hand to hand for fifteen hundred years because a catalog is a promise: what is entered here can be found again. My lesson teaches how the medieval houses kept that promise — the label, the list, and the lock — and how a shelfmark holds when memory fails. Every magnitude in your star catalogs was once someone's judgment, written down. Come and learn how the writing-down was done, and design a catalog of your own.
PROFESSOR QUILLBERRY NOCTURNE
Scrollwork Library

Creative Arts · Studio Extension E3 — Models That Move, Built as Machines
Set up square, scholars, and bring your thumbs down from your eyes — we are building the jump itself. Two viewing tubes on a true sliding rail, a near bead and a far backdrop: slide the viewpoint, and the bead shifts against the backdrop exactly as Bessel's star shifted against the sky. Built in cardboard it teaches for a week; built at my bench, with arbors that run true and a maker's plate stating your baseline, it teaches for years. And while the glue dries we will paint Professor Glimmerwick's H-R diagram as a mobile for the Tower stairwell — main sequence on the diagonal, giants high and cool, white dwarfs low and hot, every star hung at its honest place.
PROFESSOR COGBRANCH TIMBERCLANK
Creative Arts Workshop
Further Reading & Sources
- Henrietta Swan Leavitt: Wikipedia biography: her life, the Harvard computers, the 1908 and 1912 papers, and the discovery's impact on cosmology.
- Remembering Astronomer Henrietta Swan Leavitt: Center for Astrophysics, Harvard & Smithsonian: the human story: the glass plates, the thirty cents an hour, and the recognition that came a century late.
- The Period-Luminosity Relation: Wikipedia: Leavitt's Law in detail, including the 1912 graph and the later calibration history.
- Apparent Magnitude: Wikipedia: the full history of the magnitude scale, from the Hellenistic six grades through Pogson's 1856 formalization.
- Surveying the Stars: OpenStax Astronomy, via Maricopa: parallax, the parsec, and the light-year explained with worked examples, including the story of Bessel's 1838 measurement.
- The Hertzsprung-Russell Diagram: Chandra X-ray Observatory educational materials: the H-R diagram as a map of stellar evolution, with variable stars and their instability regions.
Sealed in the Celestial Tower, in deep midnight blue, by Professor Vesper Glimmerwick.
Browse the Celestial Studies shelf in the school Library for readable editions of these works.
Submit your work for this lesson using the form below.
CONTINUE IN THE CELESTIAL TOWER
← Previous · Lesson 18: The Sun: Our Star Next · Lesson 20: The Names of the Stars →
Unit IV — The Fixed Stars Celestial Tower — All 33 Lessons
The rest of Unit IV: Lesson 18 · The Sun · Lesson 20 · Star Names · Lesson 21 · Constellations · Lesson 22 · Deep Sky Wonders · Lesson 23 · Fireworks